Figure 1.

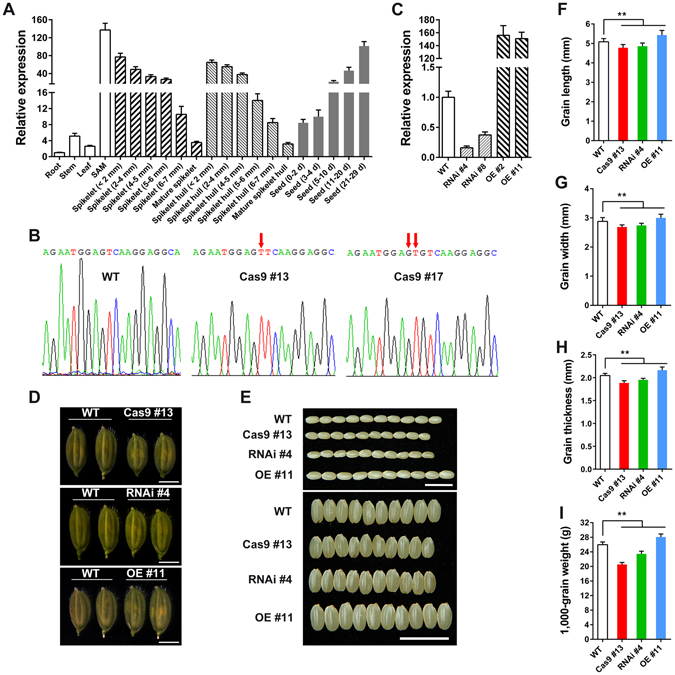
Phenotype with Overexpression and Repression of OsFH15. (A) qRT-PCR analysis of OsFH15 expression pattern in various tissues. (B) SANGER sequencing chromatography showing the mutations in Osfh15 mutant. (C) qRT-PCR analysis of OsFH15 expression from 14 d-old seedling in wild-type and transgenic plants, UBQ5 as control. (D) Spikelets of WT, Cas9 #13, RNAi #4 and OE #11 before heading. Bar = 5 mm. (E) Grains of WT, Cas9 #13, RNAi #4 and OE #11. Bar = 1 cm. (F) to (I) Grain length (F), Grain width (G) and Grain thickness (H) were determined by vernier depth. 1,000-grain weight (I) was weighed. Data are represented as mean ± SEM (n ≥ 100 in F-H, n = 15 in I). *P < 0.05, **P < 0.01, Student’s t tests were used to generate P values.
