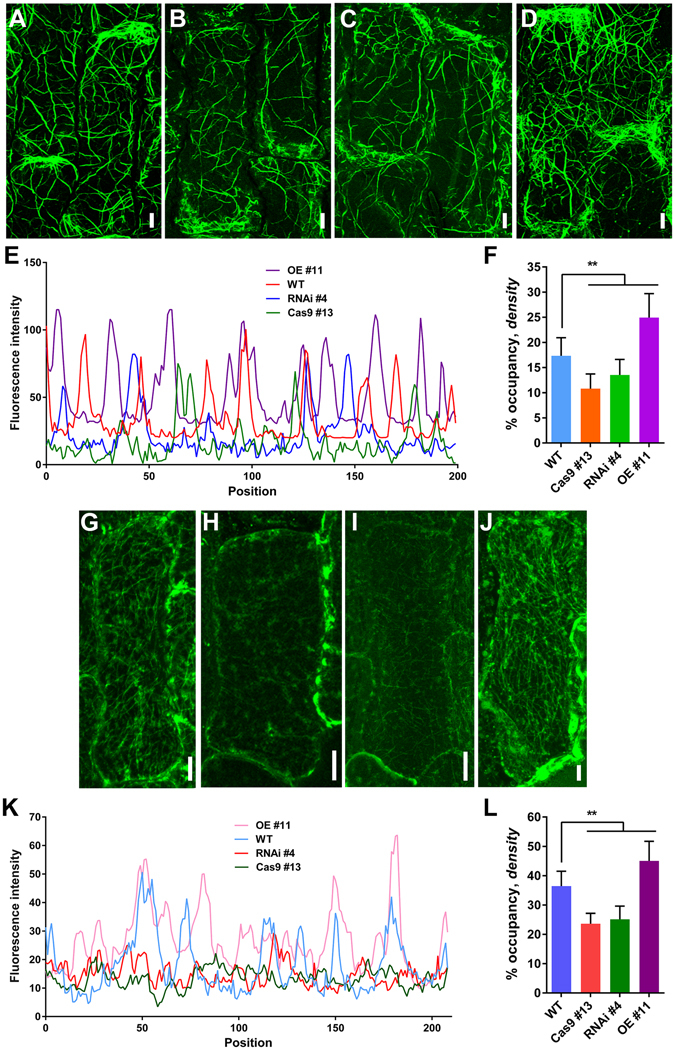
Figure 3.

AF and MT Organization in Wild-Type and Transgenic Cells. (A) to (D) AF organization was stained by Alexa Fluor 488-phalloidin, (A) WT, (B) Cas9 #13, (C) RNAi #4, (D) OE #11. (G) to (J) MTs were stained with tubulin antibody, (G) WT, (H) Cas9 #13, (I) RNAi #4, (J) OE #11. (A) to (D) and (G) to (J) The cells from the inner epidermal cells of lemmas. (E) and (K) Fluorescence intensities corresponding to the regions of cell middle part in (A) to (D) and (G) to (J), respectively. This cell middle part was marked in Supplemental Fig. 2C with white line. (F) and (L) Average AF and MT density were measured and binned for the same regions in (A) to (D) and (G) to (J), respectively. Bar in (A) to (D) and (G) to (J) = 10 μm. Data are represented as mean ± SEM (n ≥ 50 in F and L). *P < 0.05, **P < 0.01, Student’s t tests were used to generate P values.
