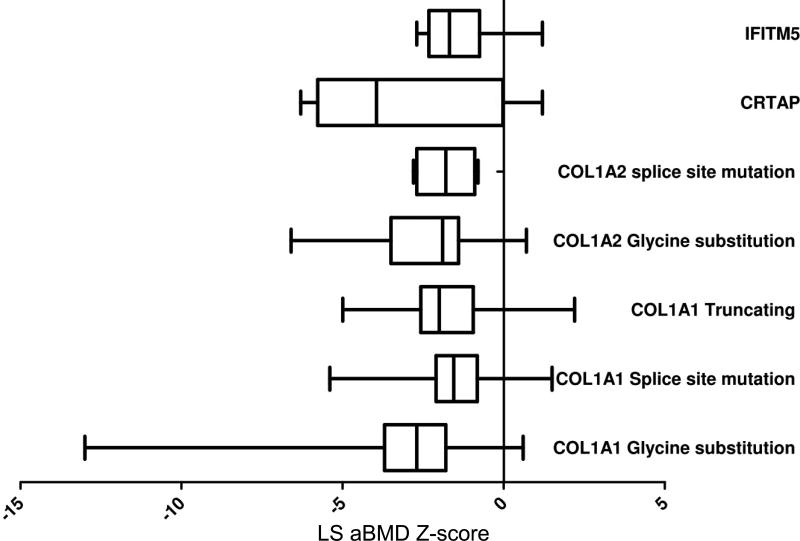
Fig. 3. LS aBMD distribution by genotype.
Box plots showing the interquartile ranges and the 5th and 95th centiles (error bars) for LS aBMD Z-scores for various OI subtypes. The type I collagen-related OI have been further categorized based on the type of mutations. Note that the mean aBMD is low across all subtypes.

