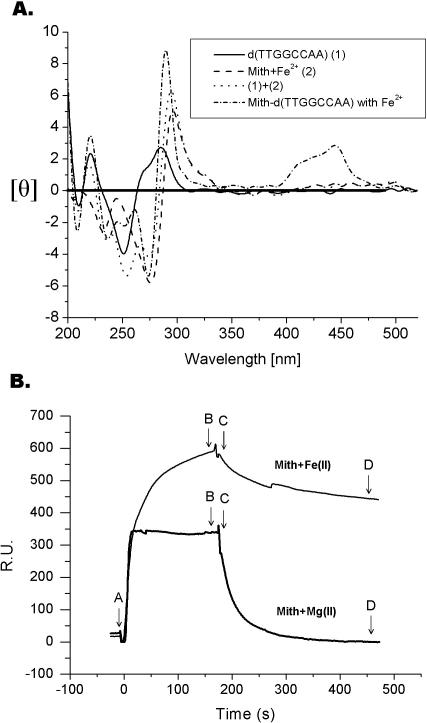
Figure 4.
(A) Comparison of the CD spectra of the [(Mith)2–Fe(II)] complex, d(TTGGCCAA)2, [(Mith)2–Fe(II)]-d(TTGGCCAA)2 complex and the sum of the CD spectra of [(Mith)2–Fe(II)] plus d(TTGGCCAA)2 in 20 mM sodium-cacodylate buffer at pH 7.3 with 100 mM NaCl at 25°C. (B) Sensorgram of Mith–DNA interaction between immobilized hairpin DNA duplex and the target [(Mith)2–Fe(II)] and [(Mith)2–Mg(II)] complexes by subtracting the reference of control. The concentration of each target is 10 μM, in 50 mM NaCl, buffered by 30 mM Tris–HCl (pH 7.3) at 20°C. The start (A) and end (B) point of the association and the start (C) and end (D) point of the dissociation are indicated by arrows.

