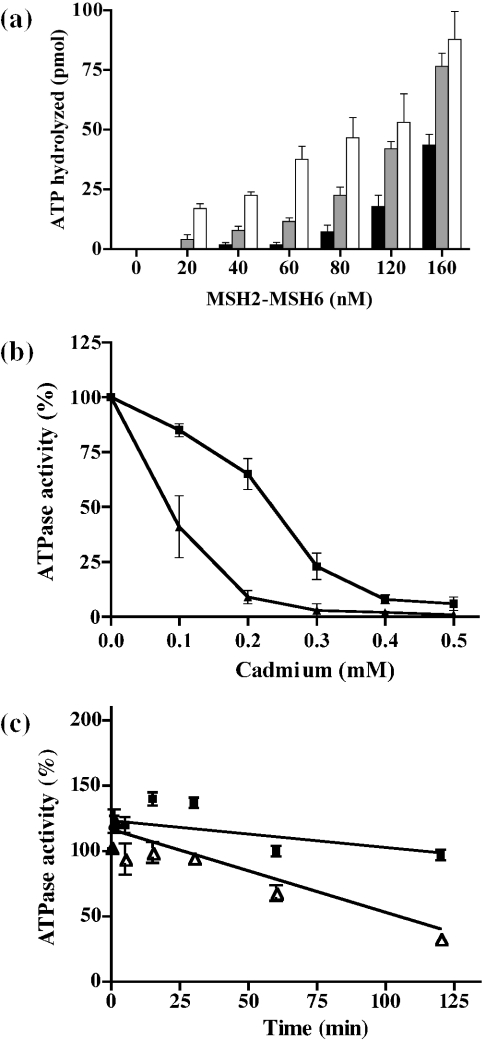
Figure 1.
Effect of cadmium on the ATPase activity of MSH2–MSH6. (a) Effect of 100 μM Cd2+ on increasing concentrations (0–160 nM) of MSH2–MSH6. Pre-incubation of Cd2+ with MSH2–MSH6 (black bars) at 4°C for 10 min followed by incubation with the reaction mixture containing ATP at 37°C for 30 min. Direct incubation of MSH2–MSH6 (gray bars) with Cd2+ and ATP in reaction mixture at 37°C for 30 min without any pre-incubation. ATPase activity of MSH2–MSH6 in the absence of Cd2+ (white bars). Each bar corresponds to the average of three experiments. Standard deviation is indicated at the top of each bar. (b) Effect of increasing concentrations of Cd2+ (0–0.5 mM) on 160 nM (closed squares) and 80 nM (closed triangles) of MSH2–MSH6. Pre-incubation of MSH2–MSH6 with Cd2+ at 4°C for 10 min was carried out. The average of three experiments for each concentration of Cd2+ is presented for MSH2–MSH6 at 160 nM and the average of four experiments for MSH2–MSH6 at 80 nM. Standard deviation is included. The curves were not fitted. (c) Time-course study over 120 min pre-incubation of the ATPase activity of MSH2–MSH6 (160 nM) in the presence (closed squares) and the absence of Cd2+ (open triangles). The average of three experiments for each time point is presented. Standard deviation is included. Curves were fitted by linear regression analysis.

