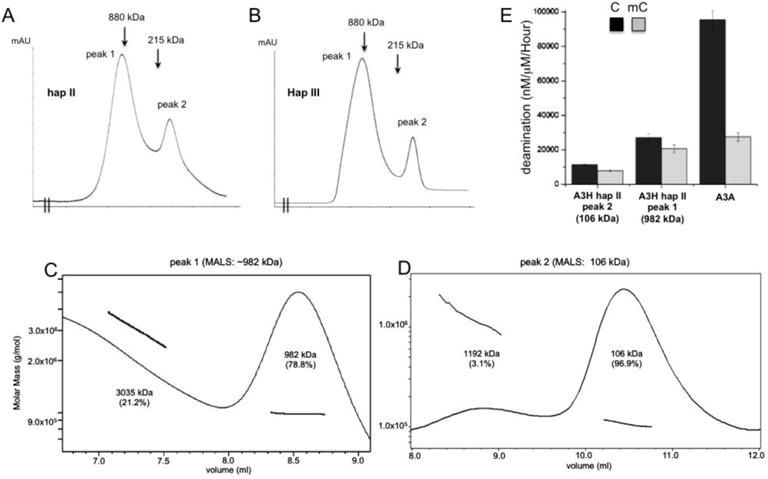
Figure 6.

Analysis of the oligomeric status of MBP-A3H hap II and hap III. (A, B) The elusion profiles of A3H hap II (panel A) and hap III (panel B) on Superose 6 size exclusion chromatography. Both haplotypes showed very similar profile, with two major elution peaks. The positions of the molecular markers 880kD (ferritin dimer) and 215kD (catalase) are indicated in the elusion profiles. The calculated molecular weight of monomeric MBP-A3H fusion is 63 kDa. (C, D) The multi-angle light scattering (MALS) analysis of the MBP-A3H hap II protein from peak 1 (panel C) and peak 2 (panel D) shown in panel A. Peak 1 has a major species of ~982 kDa, corresponding to 14–15 monomers, but the broad peak suggests that it should not be a single oligomer form, and rather should contain multiple species of oligomer forms. Peak 2 has a major species of ~106 kDa, which is slightly smaller than a dimer form, but larger than a monomer form. Presence of the 106 kDa species suggests that dimers and monomers may co-exist and equilibrate, i.e. monomers and dimers may associate and dissociate quickly to give an averaged behavior. (E) The side-by-side deaminase activity comparison between the oligomeric (peak 1 in panel A), dimeric/monomeric (peak 2 in panel A) of MBP-A3H hap II, and A3A. The oligomeric form has about 2 times higher deaminase activity than the dimer/monomer form. Error bars represent s.d. from the mean of three independent replicates.
