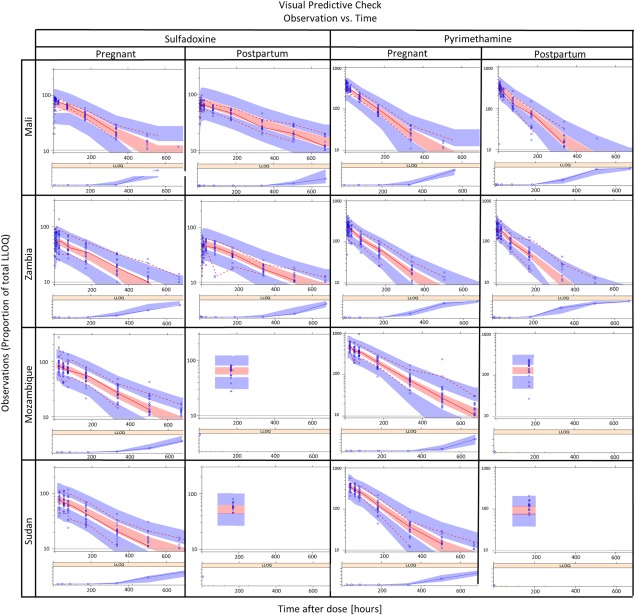
Figure 1.

Visual predictive check for the combined final model, stratified by study site, drug, and pharmacokinetic visit. The observed data are plotted as blue circles while the lines represent the 5th, 50th, and 95th percentiles of the observed data. The shaded areas represent the 95% confidence intervals for the same percentiles, as predicted by the model.
