Figure 2.

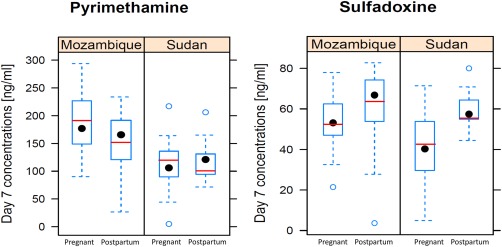
Observed day 7 concentrations in the Sudan and Mozambique sites for the pregnant and postpartum women. The boxplot summarizes the observed concentrations, while the model‐predicted median concentrations are shown as a red line.

Observed day 7 concentrations in the Sudan and Mozambique sites for the pregnant and postpartum women. The boxplot summarizes the observed concentrations, while the model‐predicted median concentrations are shown as a red line.