
Figure 2.
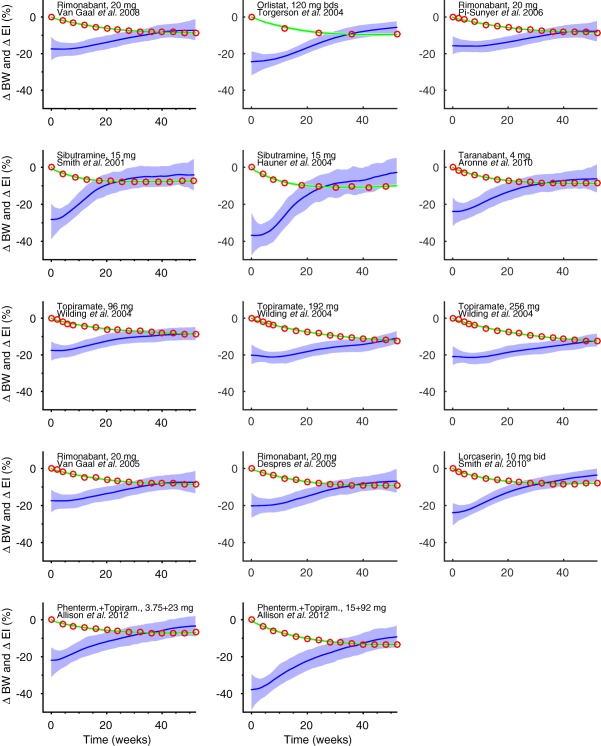
Body weight (BW) to energy intake (EI) in humans (step 1). BW data (red circles) from 14 key studies with rimonabant, orlistat, sibutramine, taranabant, topiramate, lorcaserin, and phentermine. During treatment, BW decreases initially but then tends to plateau. Plausible reasons include compensatory mechanisms increasing appetite, low compliance, or drug tolerance development, or a combination of those. Nonparametric input‐estimation was used to predict EI (blue line) by regressing Hall's body‐composition model on BW observations. The predicted EI drops initially and then returns to a level close to the initial baseline. The predicted BW curves are indicated by green lines. A 1% (peak) drug‐induced energy‐expenditure effect was assumed. The shaded areas are 95% credible intervals of EI and BW.