
Figure 3.
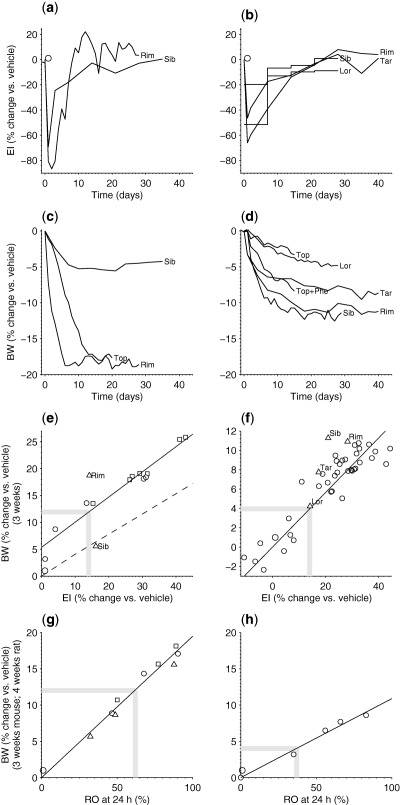
Energy intake (EI) to receptor occupancy (RO) in rodents (step 2). The left column shows data for the mouse and the right column shows data for the rat. (a) Mouse EI and (c) body weight (BW) data for rimonabant (Rim) 10 mg/kg/day, and sibutramine (Sib) 10 mg/kg/day. Mouse BW data for topiramate (Top) was 66 mg/kg/day. (b) Rat EI and (d) BW data for Rim 10 mg/kg/day, taranabant (Tar) 3 mg/kg/day, Sib 5 mg/kg/day, and lorcaserin (Lor) 4 mg/kg/day. (e) BW reduction vs. EI reduction in the mouse. AZD1979 observations (squares = female and circles = males) indicate a linear relationship (solid line). The triangles indicate corresponding data for Rim and Sib. The model15, 16 prediction (dashed line) is based on the assumption that the drug mainly targets EI and not energy expenditure. The parallel shift indicates a minor effect of AZD1979 on energy expenditure. (f) BW reduction vs. EI reduction in the rat. AZD1979 observations (circles) indicate a linear relationship (solid line). The triangles denote corresponding data for Lor, Tar, Sib, and Rim. (g) BW reduction vs. RO at 24 h in the mouse. Data for AZD1979 and other compounds of the same chemical series indicate a linear relationship (circles represent AZD1979, squares represent compound 99, and triangles represent compound 88). (h) BW reduction vs. RO at 24 h in the rat. Data from the melanin‐concentrating hormone receptor 1 antagonist ALB indicate a linear relationship as for the mouse. (e–h) The thick gray lines indicate the point estimates that give the RO‐to‐EI relationships, one for the mouse and one for the rat.