
Figure 4.
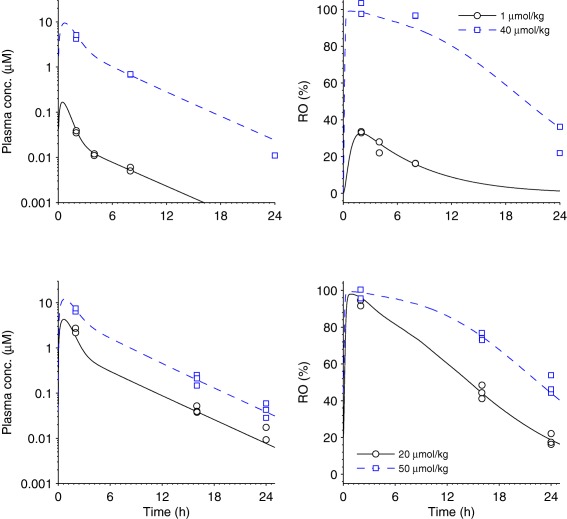
Receptor occupancy (RO) in humans to exposure in humans (step 3). Mouse exposure and RO data and model fit. Each row represents one experiment. The left column reports exposure data (squares and circles) and pharmacokinetic (PK) model fit (solid and dashed lines) for various doses indicated by the legends. The PK model was defined by the absorption rate ka = 1.93 (1.6, 2.4) h−1, the volume of distribution of the first compartment V1 = 2.02 (1.6, 2.4) L × kg−1, the maximum elimination rate Vmax = 8.19 (7.6, 9.0) µmol × h−1 × kg−1, the Michaelis‐Menten constant Km = 2.44 (2.3, 2.8) µmol, the intercompartmental clearance Q = 1.54 (1.3, 1.8) L × h−1 × kg−1, the volume of distribution of the second compartment V2 = 5.01 (4.4, 5.7) L × kg−1, and σ2 = 0.104 (0.051, 0.15) µmol2 × L−2, whereas the 5th and 95th percentiles are given within brackets. The right column gives RO data (squares and circles) and pharmacodynamic (PD) model fit (solid and dashed lines) for the corresponding doses. In the PD model, the total receptor concentration (Rtot) was fixed on a relative scale at 100%, the rate constant koff = 0.210 (0.18, 0.25) h−1, the dissociation constant KD = 0.0837 (0.078, 0.091) µmol × L−1, and σ2 = 18.8 (8.9, 29) µmol2 × L−2. The upper row represents a single‐dose acute experiment on lean mice, whereas the bottom row represents an experiment with chronic twice daily dosing on diet‐induced obese mice.