
Figure 5.
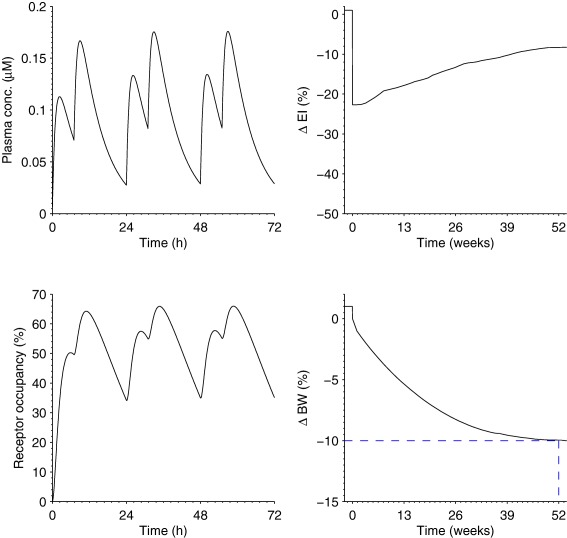
Human dose‐prediction of AZD1979. Predicted plasma‐concentration (upper left), receptor occupancy (RO; lower left) that is >50% during 16 h of the day, energy‐intake (EI) profile (upper right) with a 1‐year average of −14%, and body‐weight (BW; lower right) profile reaching a 10% decrease in 1 year. The EI profile is a nonparametric curve obtained from the average of the inferred curves of the 14 drugs of step 1.