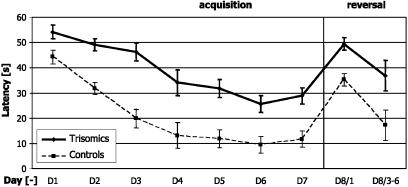
Fig. 3.
Learning curves of trisomic (solid line) and WT (dashed line) animals. Average latencies (±SEM) show that trisomics performed significantly worse than controls from day 1 on and that their performance did not improve as much as in controls during further training. The trisomic animals were initially ≈10% slower than controls, but their escape latencies were >2-fold longer on day 6. The results of the reversal experiment are shown on day 8. Escape latencies equal f (group, day).

