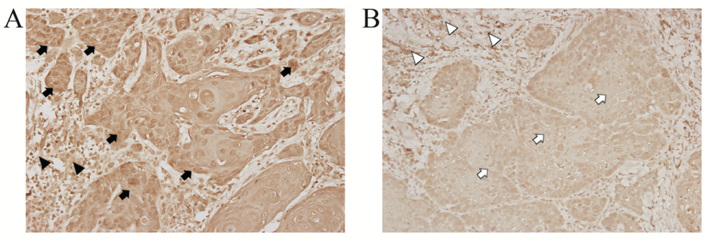
Figure 1.
Comparison of WISP-1 protein expression in OSCC tissue samples and adjacent normal tissues. (A) Representative image demonstrating WISP-1 stain intensity score of 2+ (high expression) with appreciable brown staining of OSCC cells (black arrow) compared with adjacent normal stromal tissue (black arrow head). (B) Representative image demonstrating relatively minimal staining for WISP-1 immunoreativity (1+ intensity score, low expression) with weak staining of OSCC cells (white arrow) compared with normal stromal tissue (white arrow head). Magnification, ×400. OSCC, oral squamous cell carcinoma; WISP-1, WNT1-inducible-signaling pathway protein-1.

