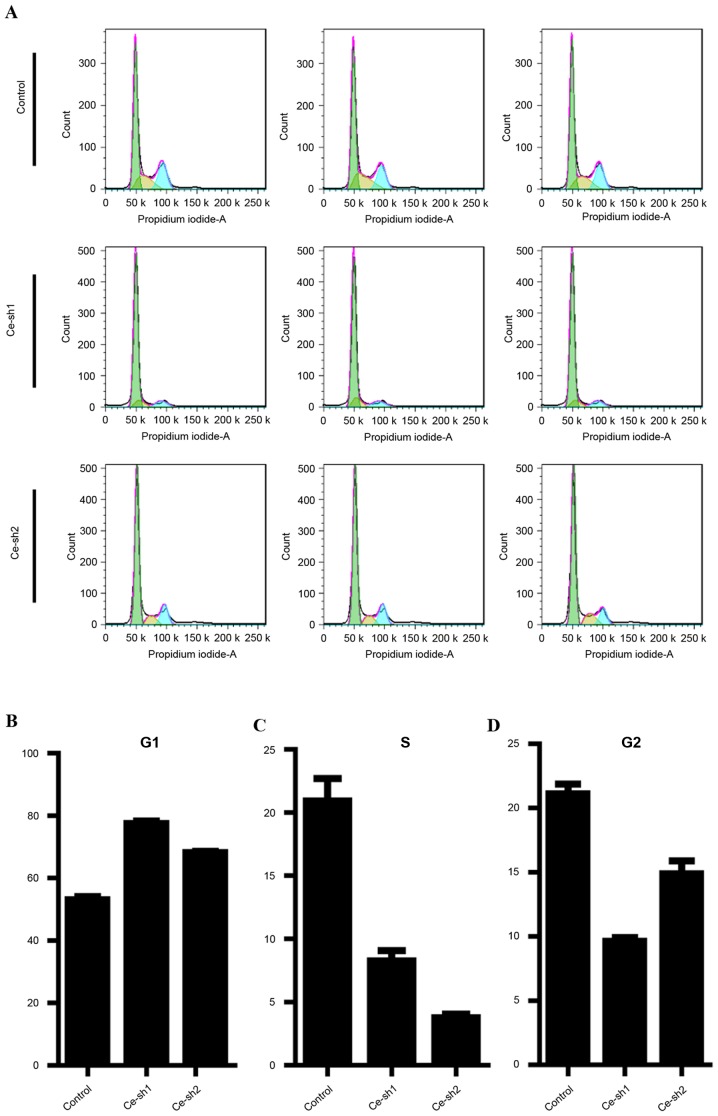
Figure 4.
Effects of CERS4 knockdown on cell cycle progression of liver cancer cells. (A) Flow cytometric histograms of HepG2 cells under each cell cycle phase. Statistical analysis of (B) G0/G1, (C) S and (D) G2/M phases of the cell cycle in HepG2 cells following knockdown of CERS4. CERS4, ceramide synthase-4.

