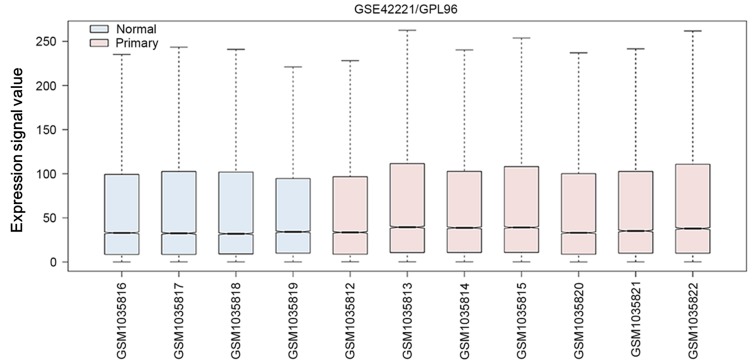
Figure 1.
Box diagram of normalization of samples included in the current study. Blue boxes represent normal samples, and pink boxes represent ALL samples (primary). The middle black line represents the median of expression value of each sample. ALL, acute lymphoblastic leukemia; GSE, Gene Expression Omnibus DataSet; GPL, Gene Expression Omnibus platform; GSM, Gene Expression Omnibus.

