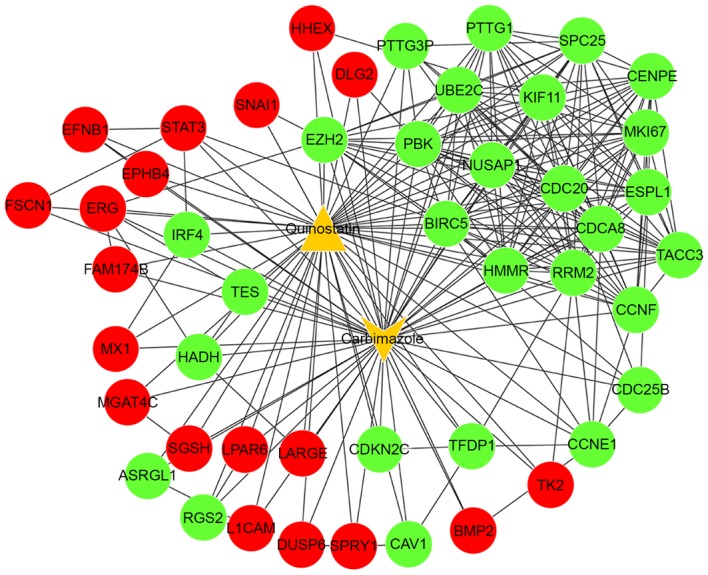
Figure 3.

The integrated network between the two small-molecule drugs (quinostatin and carbimazole) and differentially expressed genes. Red spots indicate significantly upregulated genes and green spots indicate downregulated genes. Orange triangles represent the small-molecule drugs.
