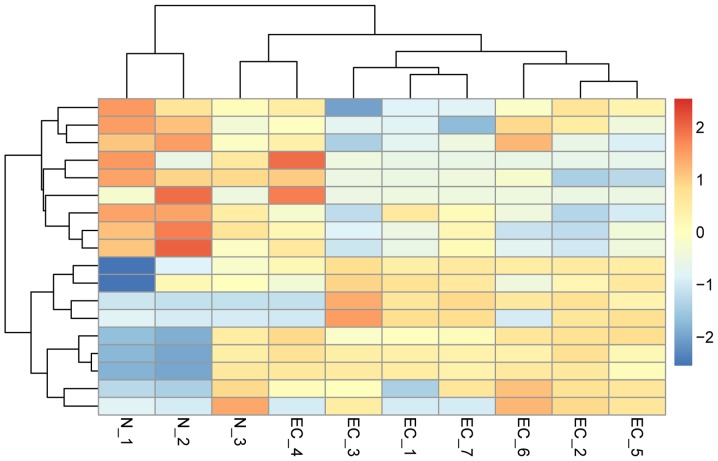
Figure 1.
Hierarchical clustering heat map of 18 differentially expressed miRNAs. Each column corresponds to a single microarray, whereas each row indicates the expression profile of a single gene. Red and blue represent high and low miRNA expression, respectively. N-1, 2 and 3 indicate salivary samples in healthy controls, while EC-1, 2, 3, 4, 5, 6 and 7 indicate salivary samples in patients with esophageal cancer. miRNA, microRNA.

