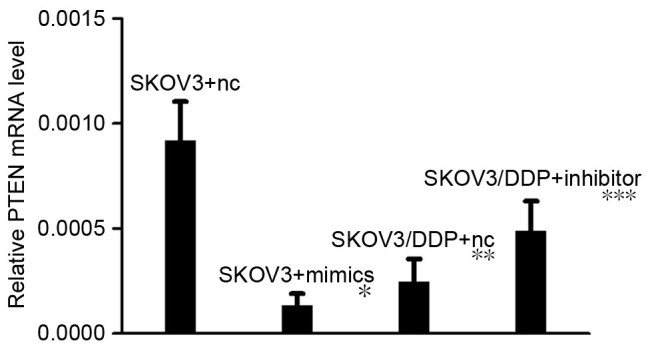
Figure 3.

PTEN mRNA expression levels in SKOV3 and SKOV3/DPP cells following transfection with miR-21 mimics and inhibitors, as assessed by reverse transcription-quantitative polymerase chain reaction. A two paired-samples t-test was used. *SKOV3 + nc vs. SKOV3 + mimics: P<0.05; **SKOV3 + nc vs. SKOV3/DDP + nc: P>0.05; ***SKOV3/DDP + nc vs. SKOV3/DDP + Inhibitor: P>0.05. PTEN, phosphatase and tensin homolog; nc, negative control.
