
Figure 6.
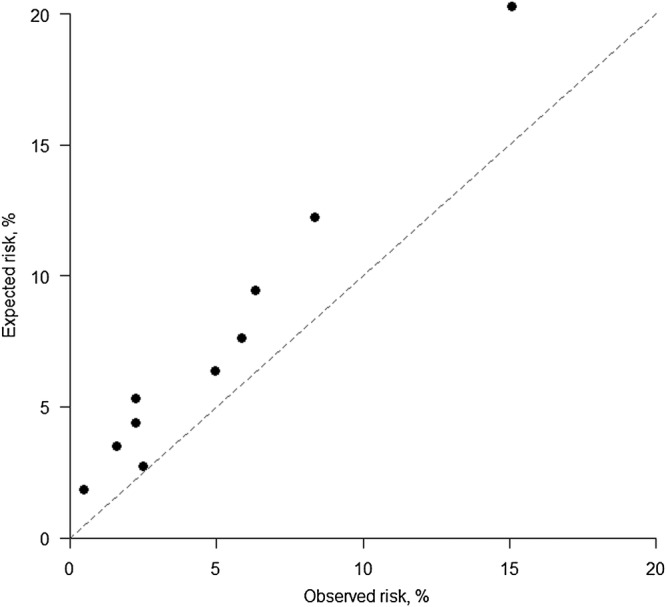
Calibration plot, applied to the testing cohort. Expected risk (from the best model from figure 3: see box 1) versus the observed risk (relative frequency of cardiovascular disease events) in the testing cohort of non-Glaswegian women. Results are shown for the (approximately) equal number of women in each of the tenths of expected risk.