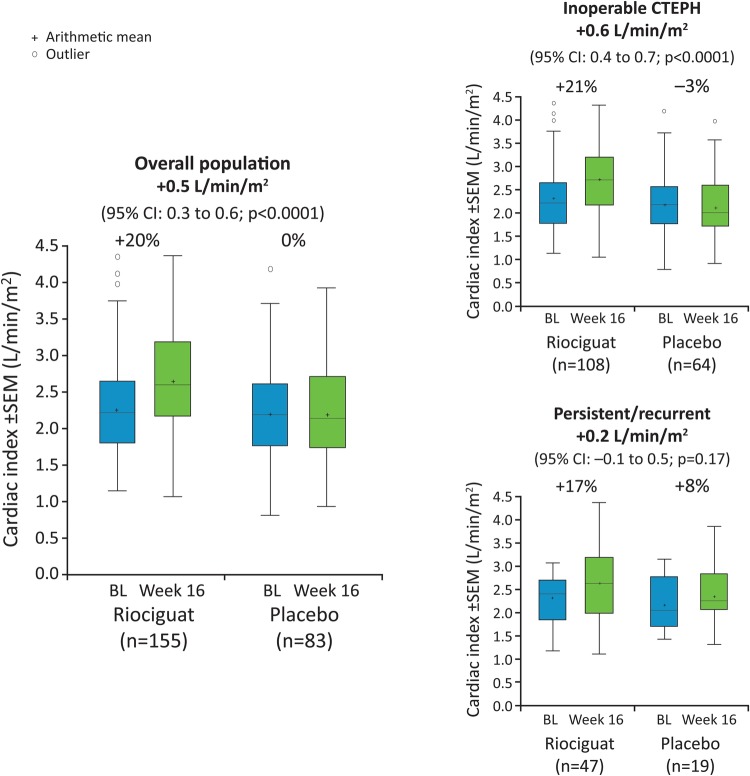
Figure 2.
Boxplots for cardiac index at baseline (BL) and CHEST-1 week 16 in the overall population and the inoperable CTEPH and persistent/recurrent PH after PEA subgroups. LS mean treatment effect (95% CI) was determined using ANCOVA. Box: 25th to 75th percentile; horizontal line: median; cross: arithmetic mean; vertical lines extend from the box to a distance of at most 1.5 IQRs; percentages refer to change from baseline in arithmetic mean. Outliers are plotted separately. ANCOVA, analysis of covariance; CHEST-1, Chronic Thromboembolic Pulmonary Hypertension Soluble Guanylate Cyclase–Stimulator Trial 1; CTEPH, chronic thromboembolic pulmonary hypertension; LS, least-squares; PEA, pulmonary endarterectomy; PH, pulmonary hypertension.

