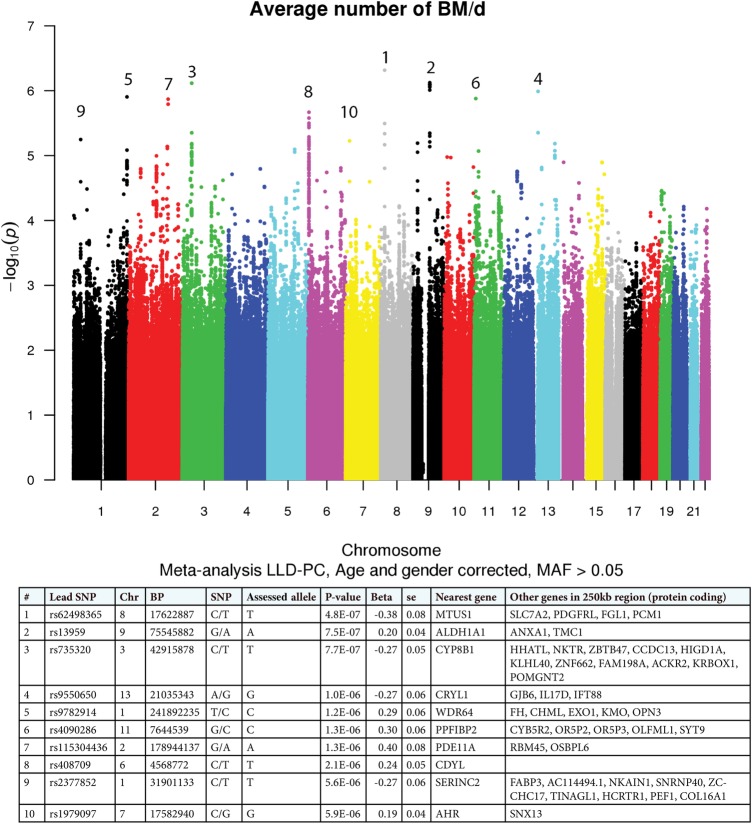
Figure 1.
Manhattan plot of the results from the meta-analysis of LifeLines-Deep (LLD) and PopCol (PC) genome-wide association studies. Single-nucleotide polymorphisms (SNPs) which are sorted according to their genomic positions are displayed on the X-axis, and the negative logarithm of the association p value for each SNP after meta-analysis is displayed on the Y-axis; each dot represents a SNP with a certain p value. The top-10 loci are indicated by numbers. Per locus, the statistics of the lead SNPs are shown, including the positions in the genome, the nearest genes and the genes in a 250 kb window around the lead SNPs. The effect of the assessed allele at each locus is indicated by beta; negative betas mean negative effect on the average number of bowel movements per day (BM/d) (decreased number of stool passes) and positive betas mean positive effect on the average number of BM/d (increased number of stool passes). Beta, direction of association; BP, base pair position; Chr, chromosome; SE, SE of the beta.

