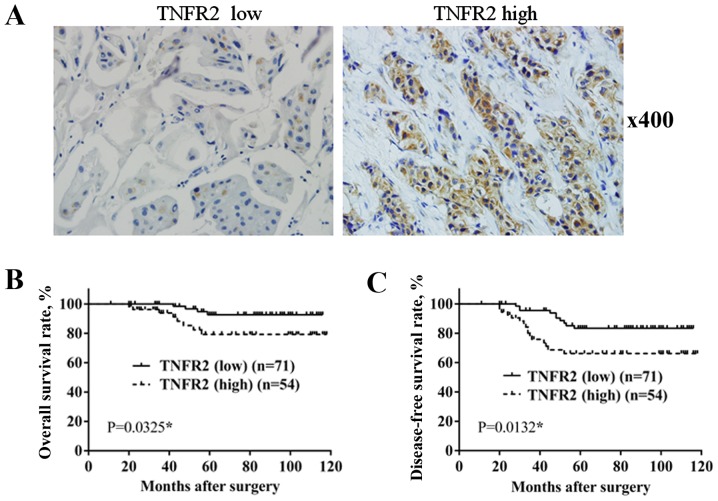
Figure 1.
TNFR2 expression in BC tissue and its association with OS and DFS rate. (A) TNFR2 expression in BC tissue by immunohistochemical staining. (B) Comparison of OS rate between TNFR2 low group and TNFR2 high group. (C) Comparison of DFS rate between TNFR2 low group and TNFR2 high group. BC, breast cancer; OS, overall survival; DFS, disease-free survival; TNFR2, tumor necrosis factor receptor 2.

