Figure 4.

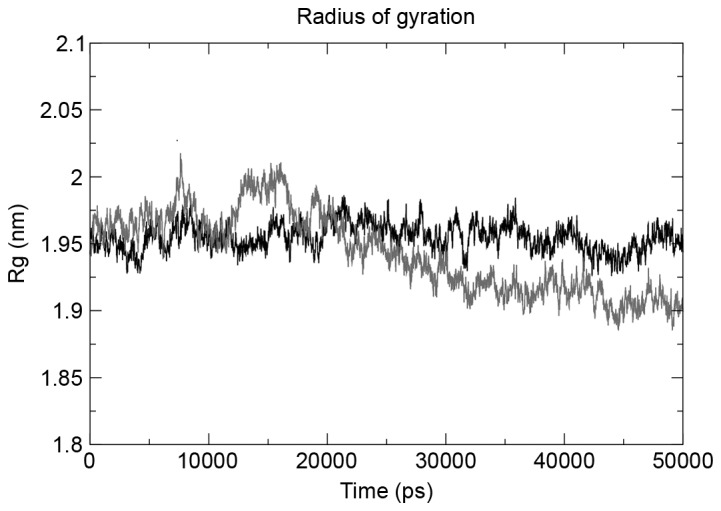
Radius of gyration plot of the two structures for a 50-nsec run demonstrated the mutant structure decreased its size following a 20-nsec run and continued to decrease until 50 nsec. Rg, radius of gyration.

Radius of gyration plot of the two structures for a 50-nsec run demonstrated the mutant structure decreased its size following a 20-nsec run and continued to decrease until 50 nsec. Rg, radius of gyration.