Figure 8.

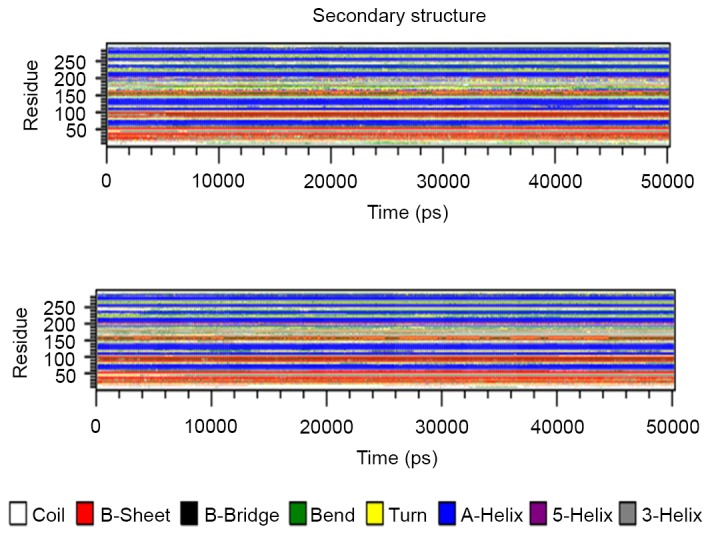
Secondary structure layout of the two structures generated using do_dssp. The structures for the analysis were captured every 100 psec.

Secondary structure layout of the two structures generated using do_dssp. The structures for the analysis were captured every 100 psec.