Figure 3.
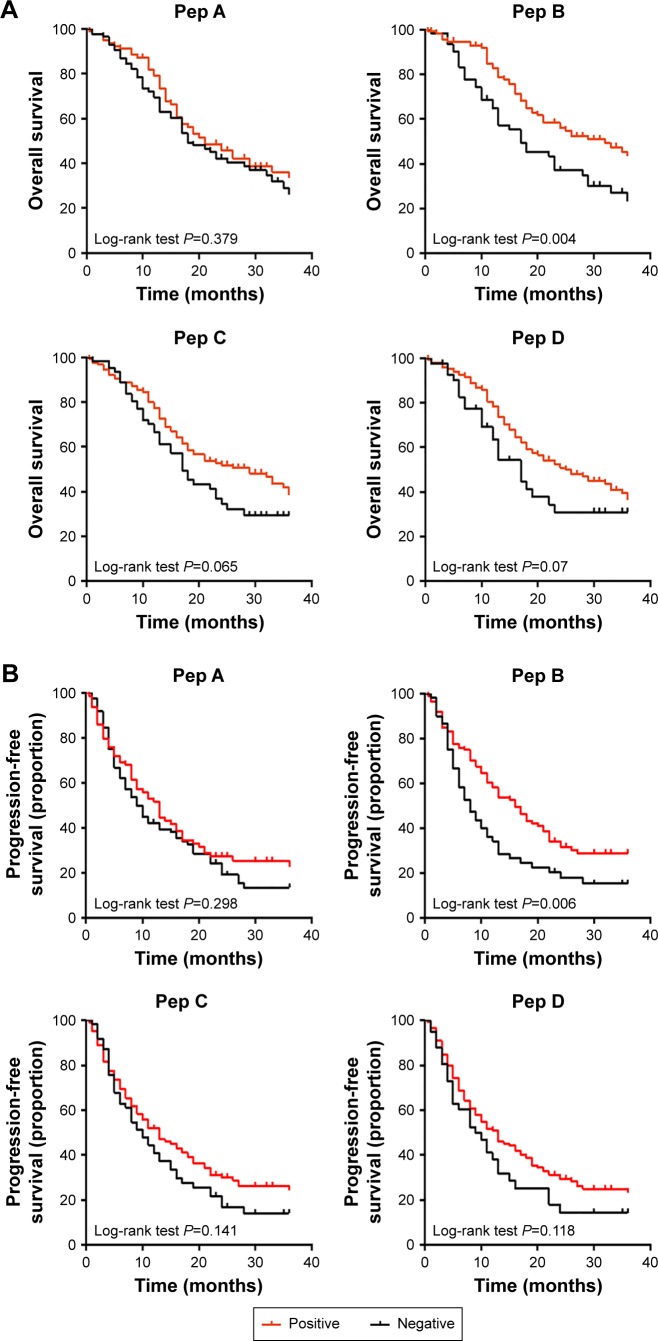
Kaplan–Meier analyses of overall survival (OS) and progression-free survival (PFS) according to the serum autoantibodies status.
Notes: Kaplan–Meier plots indicate the association between OS (A) or PFS (B) and either one of the four peptides. Samples with red line represent tumors with positive autoantibody and black line represent tumors with negative autoantibody.

