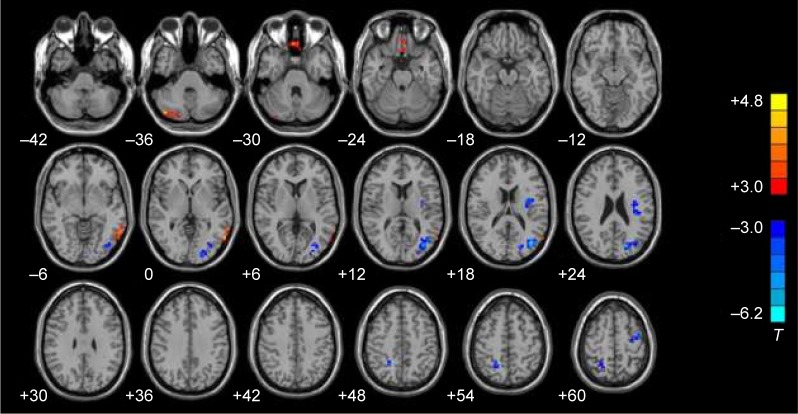
Figure 2.
ALFF changes in brain regions of aphasic patients. The red area represented brain regions with decreased ALFF compared with normal subjects, and the blue area represented brain regions with increased ALFF compared with normal subjects. Left and right images were distinguished according to the radiology convention. The numerical values at the lower right corner of each image were Z-axis values of the MNI coordinate. Two-sample Student’s t-test was used for statistical analysis (P<0.005, Alphasim corrected, cluster size >27 voxels). The results were displayed on REST slice viewer.
Notes: T>3 or <−3.0 indicates P<0.01. Red color represents positive correlations and blue color represents negative correlations.
Abbreviations: ALFF, amplitude of low-frequency fluctuation; MNI, Montreal Neurologic Institute; REST, Resting-State fMRI Data Analysis Toolkit.

