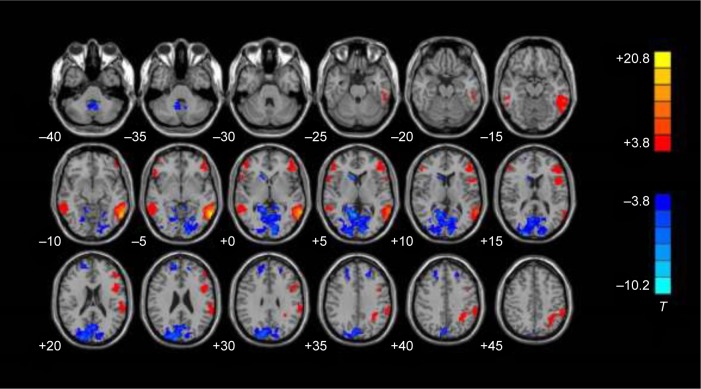
Figure 4.
Functional connectivity in the normal control group. The red area represents significant positive functional connectivity, while the blue area represents significant negative functional connectivity with the left PMTG-ROI in the normal control group. In each row, the Z coordinates of the MNI of the images ranged from z=−30 to z=55 mm (every 5 mm). The images were displayed in radiological display convention (right is left) (P<0.001, uncorrected, cluster size >40 voxels).
Notes: T>3 or <−3.0 indicates P<0.01. Red color represents positive correlations and blue color represents negative correlations.
Abbreviations: PMTG, posterior middle temporal gyrus; ROI, region of interest; MNI, Montreal Neurologic Institute.

