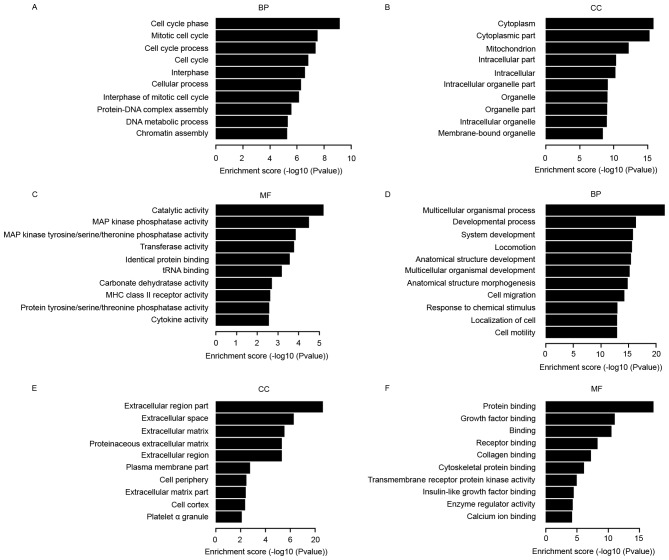
Figure 3.
Gene ontology analysis. The bar plots show the 10 most significant enrichment terms with the most number of differentially expressed genes. The ontology covers three domains: BP, CC and MF. (A-C) Upregulation in cancer vs. normal cells. (D-F) Downregulation in cancer vs. normal cells. MAP, mitogen-activated protein; MHC, major histocompatibility complex; BP, biological processes; CC, cellular components; MF, molecular function.

