
Figure 1.
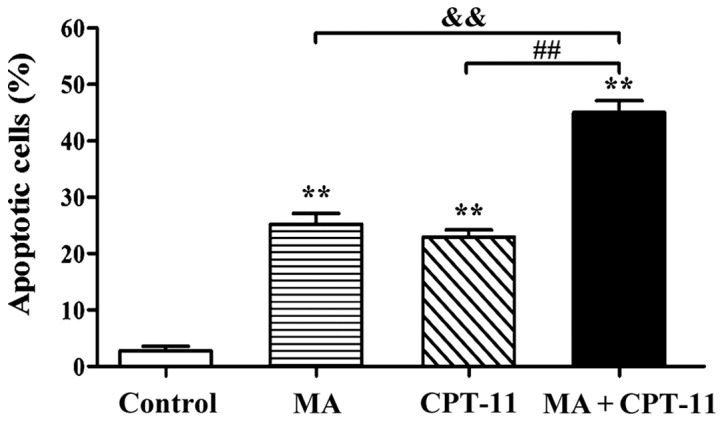
Flow cytometry measurement of apoptosis rates of different treatment groups. **P<0.01, compared with normal control group; &&P<0.01, combination treatment group compared with MA treatment alone group; ##P<0.01, combination treatment group compared with CPT-11 treatment alone group. MA, matrine; CPT-11, irinotecan.