Figure 2.
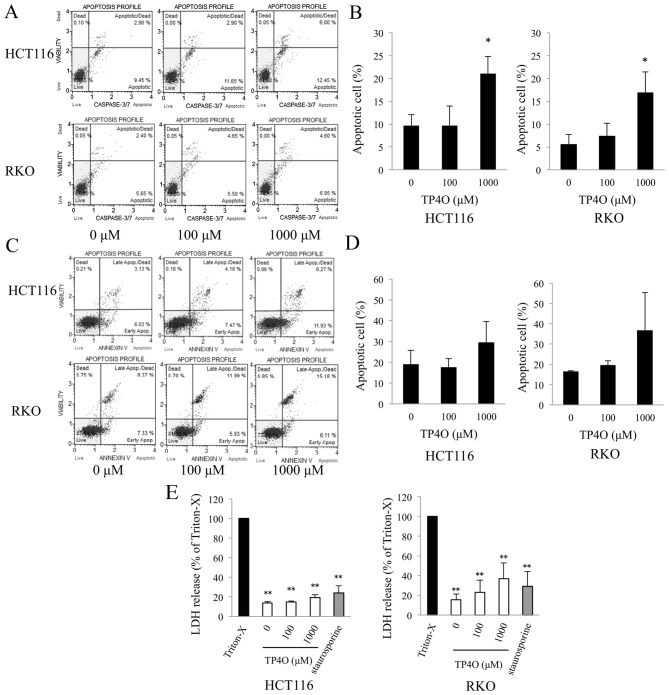
TP4O induces the apoptosis of human CRC cell lines. (A) HCT116 and RKO cells were treated with the indicated concentrations of TP4O for 6 h. Caspase-3/7 activity and cell viability were measured by flow cytometry. Caspase-3/7 activity was detected by fluorescence of a DNA-binding dye and cell viability were detected with the detection of 7-aminoactinomycin D fluorescence using the Muse™ Cell Analyzer. (B) The percentage of apoptotic cells, which are located in the top- and bottom-right quadrants, is presented. The values were compared with those obtained with 0 µM TP4O. The data are presented as the mean ± SD. *P<0.05. The results were obtained from three independent experiments. (C) HCT116 and RKO cells were treated with the indicated concentrations of TP4O for 12 h. The extent of apoptosis was measured with Annexin V staining. (D) The percentage of apoptotic cells, which are located in the top- and bottom-right quadrants, is presented. The values were compared to with those obtained with 0 µM TP4O. The data are presented as the mean ± SD. The results were obtained from four independent experiments. (E) HCT116 and RKO cells were treated with the indicated concentrations of TP4O for 12 h, and the LDH level in the supernatant was measured. The values were compared with those obtained with 1% Triton X-100 as the control (100%). To determine whether LDH release was associated with necrosis or apoptosis, cells were treated with Triton X-100 or staurosporine, respectively. The data are represented as the mean ± SD. **P<0.01. The results were obtained from three independent experiments. TP4O, terpinen-4-ol; CRC, colorectal cancer; IC50, half maximal inhibitory concentration; SD, standard deviation; LDH, lactate dehydrogenase; Apop., apoptosis.

