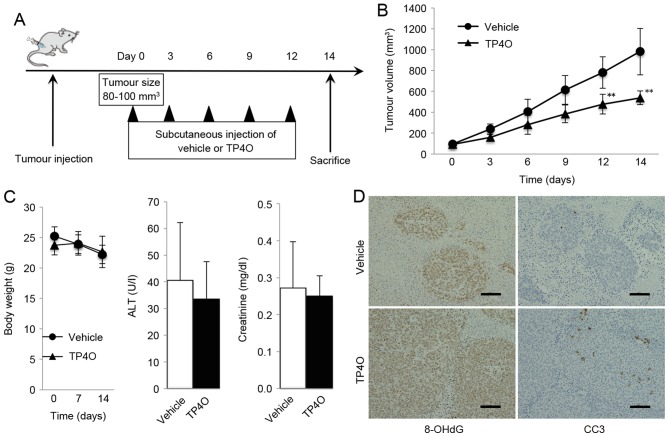
Figure 6.
In vivo antitumor activity of TP4O in a xenograft model. (A) Schematic experimental design. A total of 2×10⁶ HCT116 cells were subcutaneously injected into the right flank of ICR-SCID mice receiving 250 µl of vehicle or TP4O (200 mg/kg) every 3 days by subcutaneous injection. Mice were sacrificed 14 days after the first day of administration. (B) Tumor volume was measured over time. Increase in tumor volume was suppressed in the TP4O group. The data are presented as the mean ± standard deviation. **P<0.01. (C) Mice were sacrificed after 14 days, and body weight as well as serum levels of ALT and creatinine were measured. (D) Tumors were stained with antibodies against 8-OHdG and CC3. 8-OHdG- and CC3-stained positive areas were assessed by the ratio of the stained area to the entire tumor area in high-magnification (×200) digital images in three randomly selected fields for each sample. Scale bars represent 100 µm. TP4O, terpinen-4-ol; CC3, cleaved caspase-3; 8-OHdG, 8-hydroxy-2′-deoxyguanosine; ALT, alanine aminotransferase.

