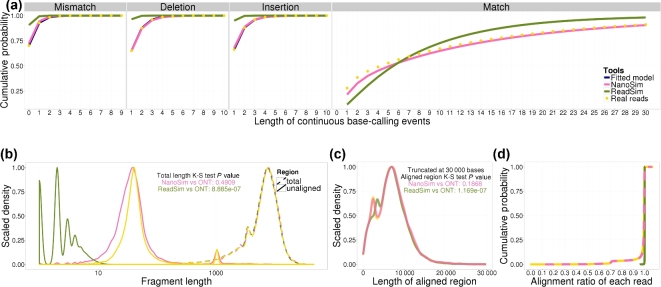
Figure 1:
NanoSim and ReadSim simulation results compared with UCSC E. coli experimental reads. (a) The four plots on the upper panel are cumulative density plots of error match events and error events. (b) Length density plot of unaligned regions and total read lengths of aligned reads. (c) Length density plot of aligned regions on each read. (d) Cumulative density plot of the alignment ratio of each read.

