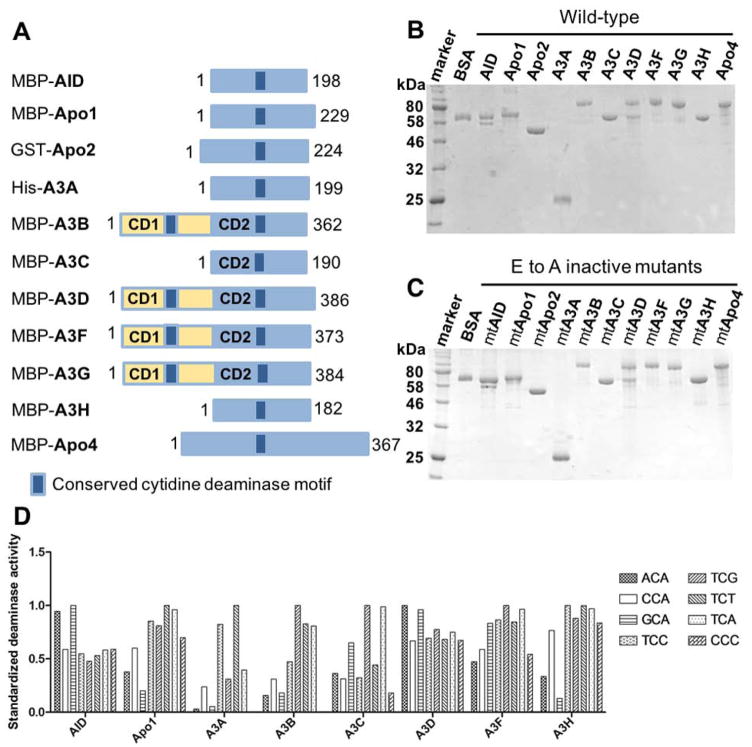
Figure 1. Protein purification and deaminase activity on various tri-nucleotide motifs of eleven APOBEC members.
(A) Schematic representation of the constructs for the eleven members of APOBEC family containing one or two Zn-coordinating conserved catalytic motifs (dark blue box) used in this study. The N-terminal fusion tags (His, GST, or MBP) for each purified APOBEC are indicated. (B, C) SDS-PAGE analyses of the purified proteins for the eleven wild-type (wt) (B) and catalytically inactive E to A active site mutants (C) of APOBECs with N-terminal affinity tags. APOBEC proteins were purified from the soluble fraction of E. coli cell lysate in lysis buffer (20 mM Tris-HCl, pH 8.0, 250 mM NaCl, and 2 mM DTT) by affinity column chromatography as previously described [50]. (D) Deaminase activity of the purified wt APOBECs on 8 different tri-nucleotide substrate motifs. The motifs include NCA and TCN, where N is any of the four nucleotides, as well as a CCC motif. The proteins not shown on the chart are Apo2 and Apo4 that had no detectible activity and A3G that has been shown to deaminate CCC as a preferred motif in our previous publications [4, 74]. Deaminase assay was performed as previously described [49, 50, 62]. Briefly, APOBECs were incubated with 600 nM 5′ 6FAM-labeled ssDNA (30 nt) in deamination buffer (25 mM HEPES, pH 6.5, 100 mM NaCl, 0.1% Triton X-100, 1 mM DTT, and 0.1 μg/ml RNase A) at 37°C for 2 hours. The reactions were terminated by heat inactivation at 90°C for 5 min. The deamination product uracil bases were subsequently cleaved by incubating with UDG (2 units, NEB) for 1 hr at 37°C The abasic sites were then hydrolyzed with 0.1 M NaOH at 90°C for 10 min. Deamination products were analyzed on 20% denaturing PAGE gels, and quantified with Molecular Imager FX Pro Plus System/Quantity One® analysis software (Bio-Rad). The activity shown for each APOBEC on the chart was normalized by dividing the activity on each motif by the maximum activity among the eight substrates (the most preferred motif).

