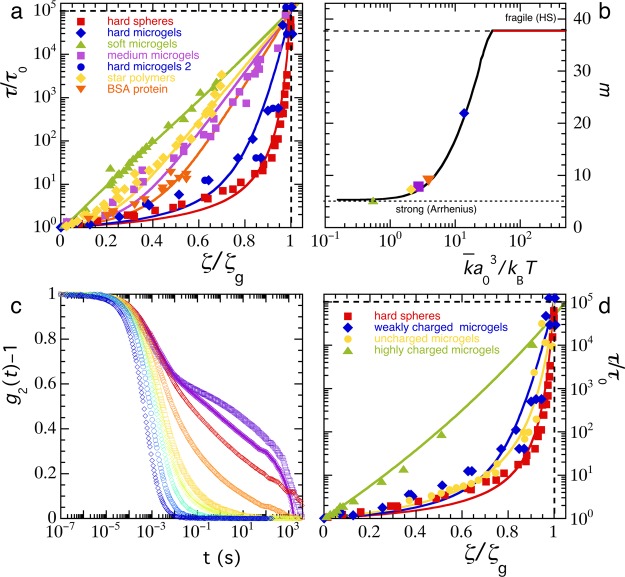
Figure 3.
(a) Angell plot for various systems of compressible spheres, symbols (defined in legend): experimental data for hard spheres (a0 ∼ 130 nm),11 various microgels (a0 ∼ 90 nm),13,40 star polymers (a0 ∼ 20 nm),37 and the globular protein bovine serum albumin (a0 ∼ 5 nm),41 drawn lines: predictions from the model as outlined in the text with k̅ as the adjustable parameter. (b) Fragility index m as a function of k̅a03 as predicted by the model (line) and for the data sets in (a) (symbols). (c) Intensity correlation functions from dynamic light scattering for uncharged polystyrene microgels with (from left to right) ζ = 0.64, 0.88, 1.02, 1.03, 1.19, 1.25, 1.30, 1.35. (d) Angell plot for compressible colloids of varying charge density: hard spheres,11 weakly charged microgels,13,40 uncharged microgels from (c), and highly charged microgels,36 drawn lines: predictions from the model.

