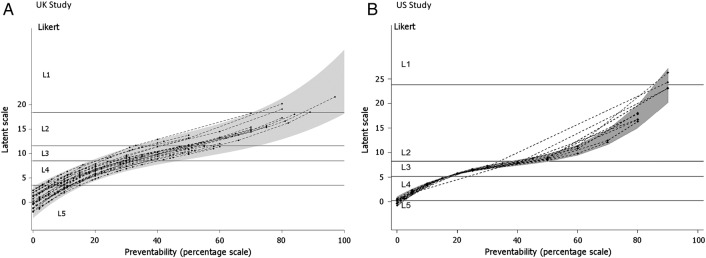
Figure 2.
Estimated calibration plots for reviewers (22 UK; 13 USA) from a random slopes ordinal regression model. (A) UK study. (B) US study. A point on a curve represents the average latent score assessment given by an individual reviewer to a case note with a given percent preventability score. The shaded grey area defines a 95% prediction region over the population of reviewers for the mean latent score assigned to a given preventability percentage. The horizontal lines represent divisions on the latent scale corresponding to the Likert categories L1–L5.

