Figure 4.

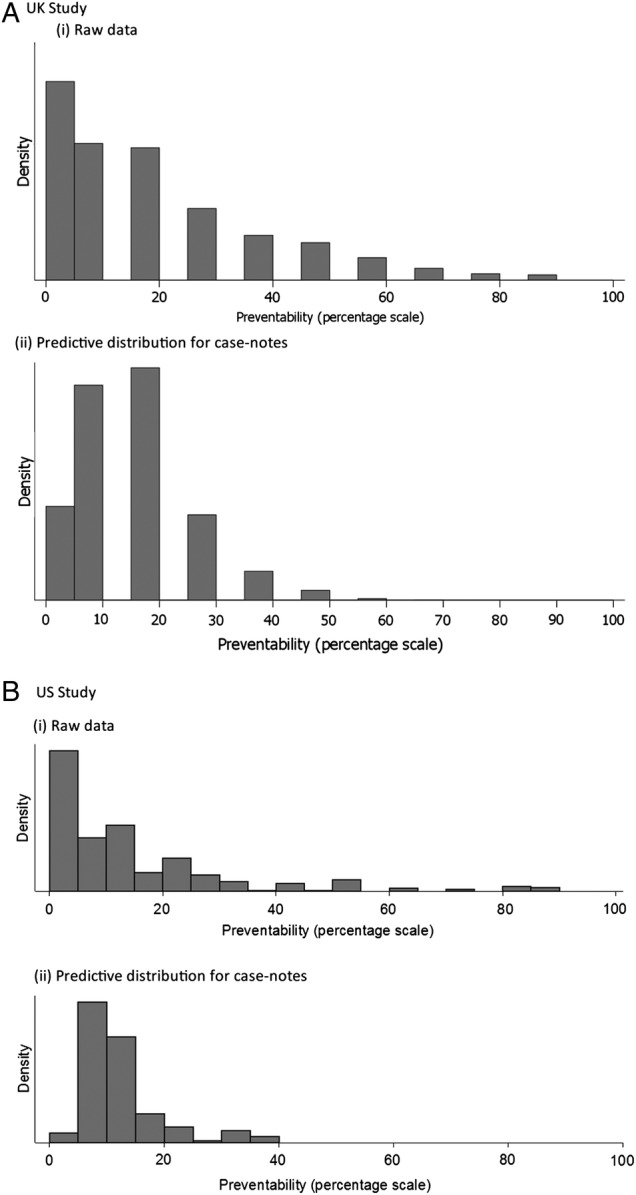
Distributions of percentage preventability: (i) raw data and (ii) predictive case note distribution after fitting a categorical model. (A) UK study. (B) US study.

Distributions of percentage preventability: (i) raw data and (ii) predictive case note distribution after fitting a categorical model. (A) UK study. (B) US study.