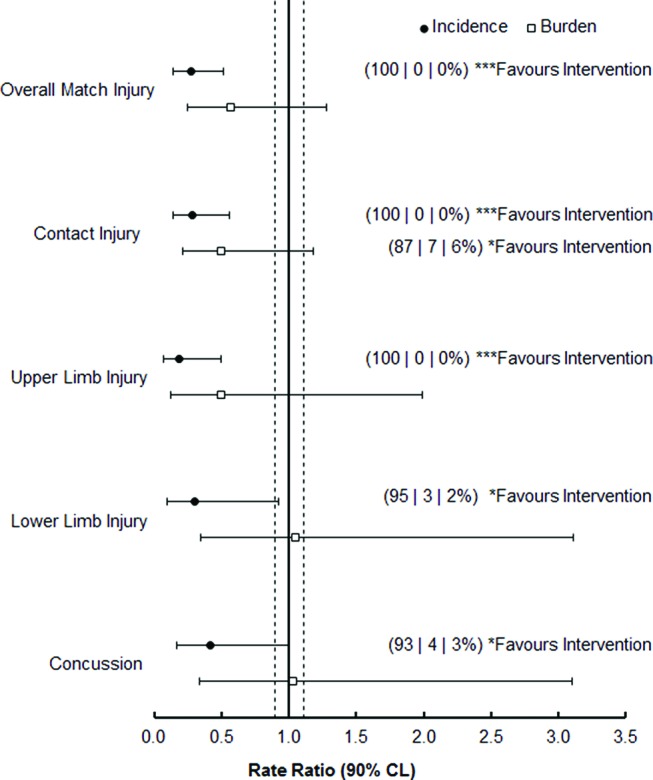
Figure 3.

Forest plot illustrating the results of the per-protocol analyses on the effect of trial arm on injury measures in teams with a mean programme completion rate of more than three completions per week (n=7 schools, 12 teams). Data points represent RR of injury measures in the intervention arm relative to the control arm (reference group, RR=1.00). Dotted vertical lines represent thresholds for smallest worthwhile effects (RR=0.90 and 1.11). Data labels represent the per cent likelihood that each effect favours the intervention | is trivial | favours the control, for outcome variables which demonstrate a clear effect of trial arm allocation. *Likely, ***most likely. CL, confidence limits.
