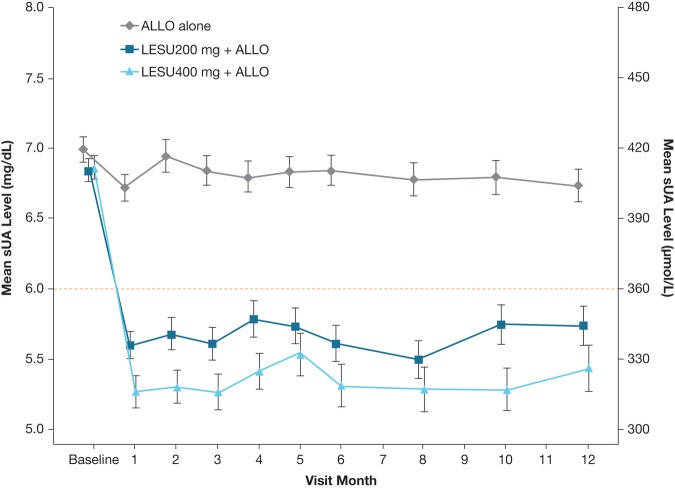
Figure 4.
Graph showing the mean (SE) sUA levels by visit (observed cases, intent-to-treat population). Mean change from baseline for each active treatment group was compared with the ALLO-alone group using analysis of covariance, with p<0.001 at each time point. ALLO, allopurinol; LESU, lesinurad; sUA, serum uric acid.

