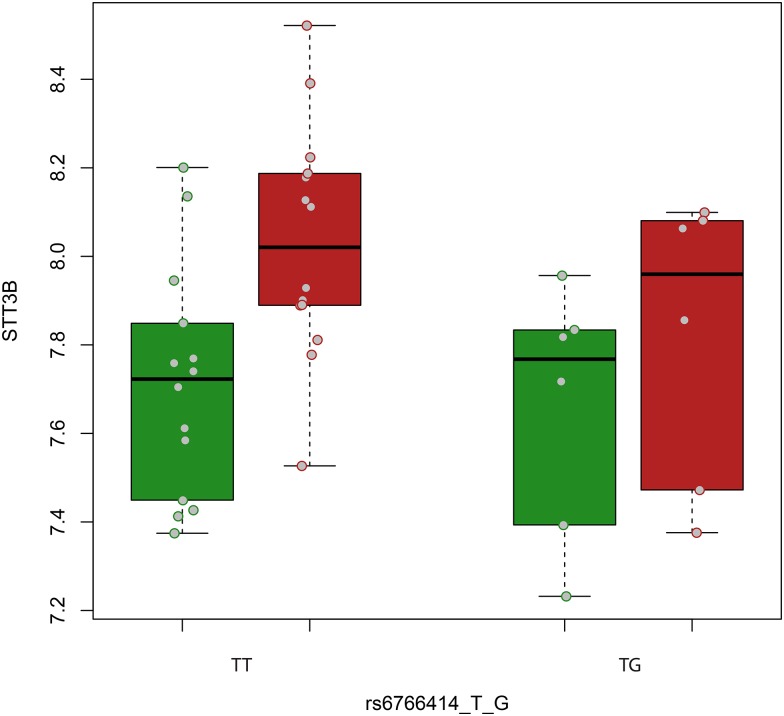
Figure 3.
Box plots of the expression levels of STT3B in patients with hypertrophic/normotrophic osteoarthritis (OA), plotted as mean normalised probe level values, in macroscopically intact (green boxes) and diseased (red boxes) OA articular cartilage stratified by carriers of the G allele (heterozygous individuals plotted since no homozygotes for the G allele were present in our data) and by non-carriers at rs6766414. Grey dots show values of each individual sample.

