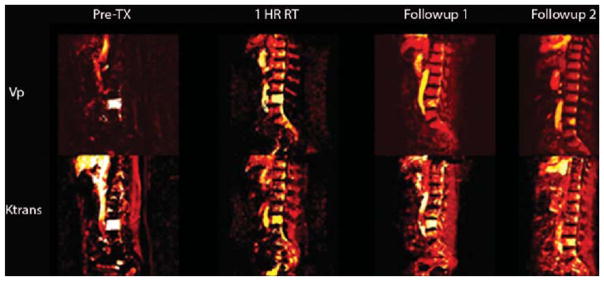
FIG. 2.
Sagittal T1-weighted DCE MRI perfusion maps for the parameters Vp and Ktrans at times pre-RT, 1 hour post-RT, and subsequent follow-ups. The images were obtained in the patient in Case 6 and show the perfusion of spine metastasis to L-4 from renal cell carcinoma. The Vp decreased from 36.7 preoperatively to 1.85 at 1 hour post-RT (a 95% decrease). The Ktrans map shows a similar decrease from 14 preoperatively to 4 at 1 hour post-RT (a 71.4% decrease). TX = treatment.

