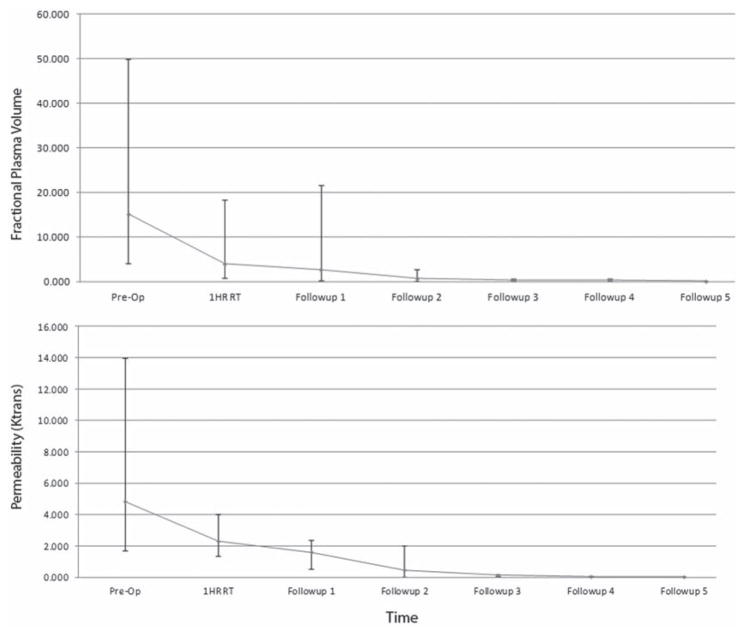
FIG. 3.
A line plot illustrating the median Vp and Ktrans at various times, including before RT, 1 hour after RT, and at different follow-up sessions. The bars and whiskers illustrate the range in Vp and Ktrans values recorded from the patients’ T1-weighted DCE MRI scans. The Vp ranged from 4.1 to 50 before RT and from 0.78 to 18.3 at 1 hour after RT. The Ktrans ranged from 1.7 to 14 before RT and from 1.35 to 4 at 1 hour after RT.

