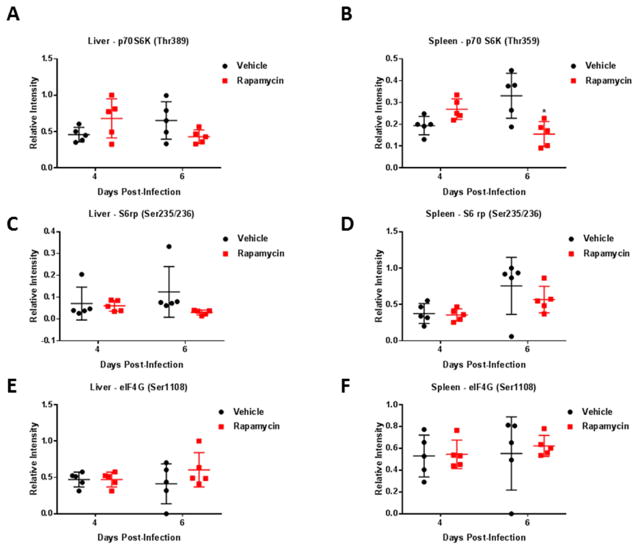
Figure 8. Pathway modulation screening in the liver and spleen following rapamycin treatment.
Female BALB/c mice, 6–8 weeks of age, were infected via the subcutaneous route with a high dose of RVFV ZH501 (1,500 PFU/mouse). Mice were randomly distributed into groups of 5 with subsequent serial sacrifice of vehicle treated control mice and rapamycin (10mg/kg) treated mice on days 4 and 6. Liver and spleen were collected and placed in blue lysis buffer for downstream RPPA analysis. Data plotted represents means and standard deviations from 5 animals per condition. Black circles and red squares represent vehicle treated or rapamycin treated mice, respectively. Phospho-protein levels in the liver (A, C, E) or spleen (B, D, F) of both vehicle control and rapamycin treated groups on days 4 and 6 post-infection are displayed. A two-way ANOVA analysis was used to evaluate changes in protein phosphorylation, *p-value ≤ 0.05.

