
Figure 3. Osteoid and mineralization in the various groups of mice.
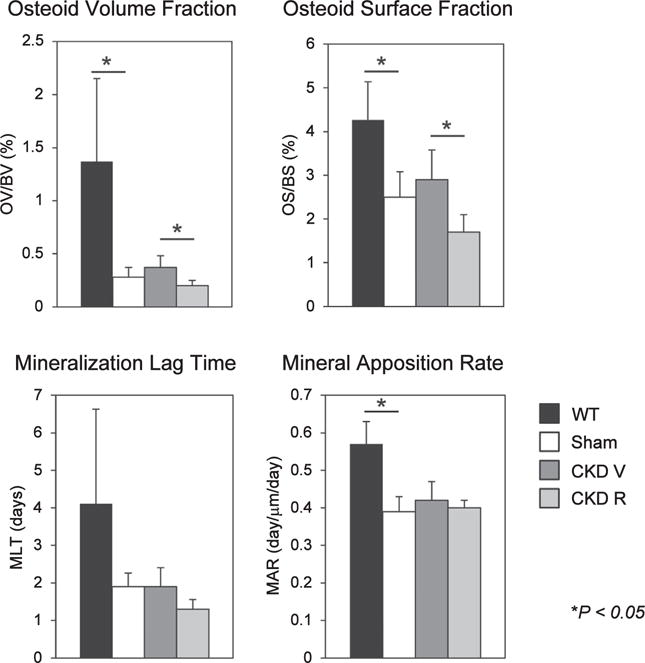
Osteoid volume (OV), osteoid surface (OS), and mineral apposition rate (MAR) were decreased in the sham (Ldlr−/− high-fat fed) mice. Chronic kidney disease (CKD) did not affect these parameters compared with sham mice. RAP-011 treatment decreased OV and OS compared with chronic kidney disease mice treated with vehicle (CKD V). **P < 0.01 for comparisons between wild type (WT) and sham and between CKD V and CKD R. CKD R, CKD+RAP-011.