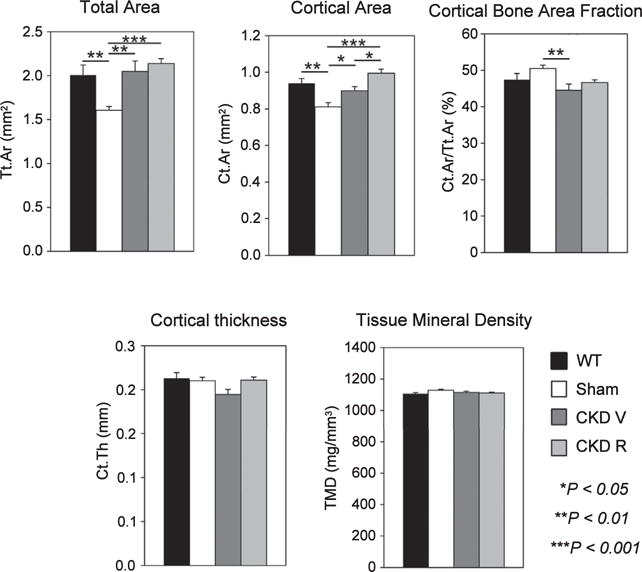
Figure 5. Micro computed tomography analysis of cortical bone.

Total and cortical bone area were decreased in the sham (ldlr−/− high-fat fed) mice. Chronic kidney disease increased total cortical area (Tt.Ar), decreased cortical bone area fraction (Ct.Ar/Tt.Ar) and decreased cortical bone thickness (Ct.Th). RAP-011 treatment increased cortical bone area (Ct.Ar) and cortical thickness (Ct.Th). CKD R, CKD+RAP-011; TMD, tissue mineral density; WT, wild type *P < 0.05 for comparisons between sham and CKD V and between CKD V, chronic kidney disease mice treated with vehicle (CKD V) and CKD R; **P < 0.01 for comparisons between WT and sham and between sham and CKD V; ***P < 0.001 for comparisons between sham and CKD R.
