
Figure 3.
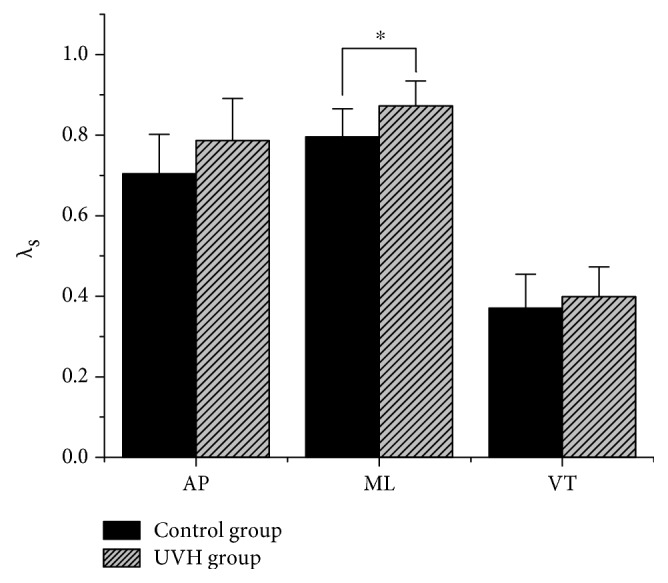
Mean λs values in all three directions. Asterisks indicate a significant difference (P < 0.05) between the two groups. Error bars show the standard deviation of λs.
Official websites use .gov
A
.gov website belongs to an official
government organization in the United States.
Secure .gov websites use HTTPS
A lock (
) or https:// means you've safely
connected to the .gov website. Share sensitive
information only on official, secure websites.
Mean λs values in all three directions. Asterisks indicate a significant difference (P < 0.05) between the two groups. Error bars show the standard deviation of λs.