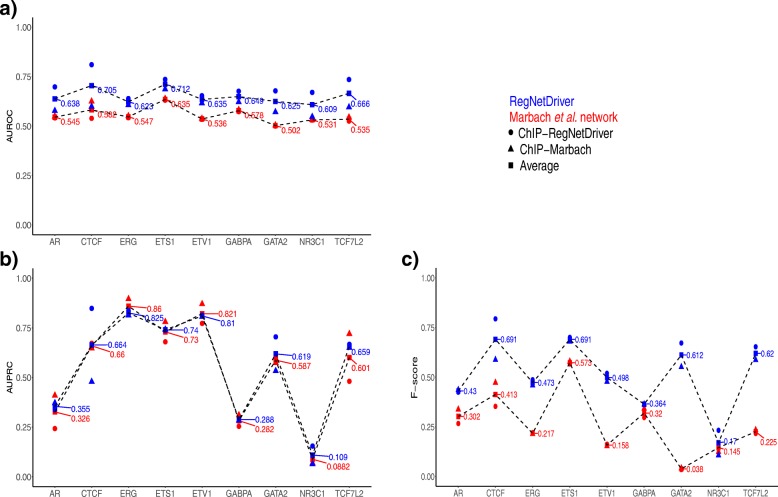
Fig. 3.
a Area under receiver operator characteristic curve, b Area under precision-recall curve (AUPRC), and c F scores for TF–target gene edges in the prostate epithelial networks of RegNetDriver (blue) and Marbach et al. (red). ChIP-Seq binding peaks of nine TFs (shown on the x-axis) and promoter–gene and enhancer–gene annotations from both networks are used for network evaluation. ChIP-Seq-based targets using RegNetDriver annotations are referred to as ChIP-RegNetDriver, shown in circles and targets using Marbach annotations are called ChIP-Marbach, shown in triangles. Square data points correspond to mean values computed using ChIP-RegNetDriver and ChIP-Marbach targets. TF transcription factor

