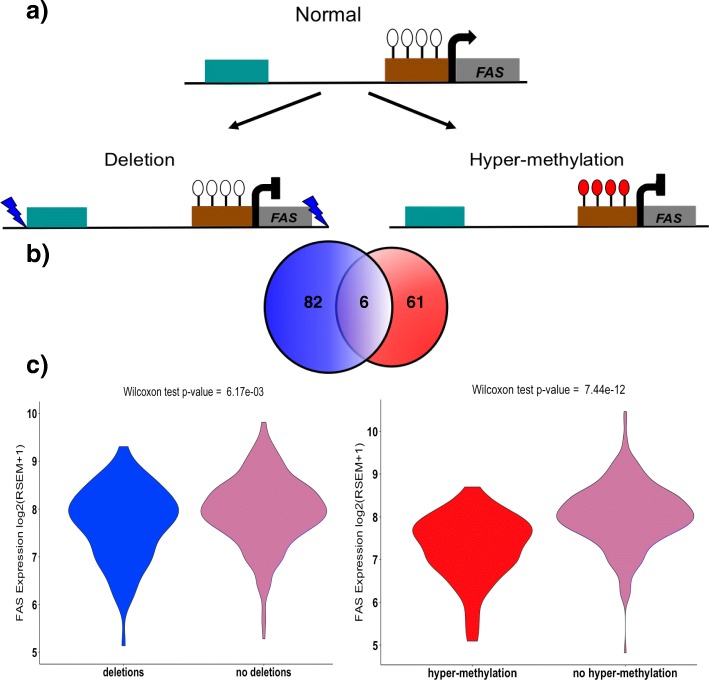
Fig. 5.
Effect of genetic and epigenetic alterations on gene expression. a Schematic showing the effect of deletion and hyper-methylation of the promoter region on expression of FAS (enhancers are shown in bluish green and the promoter in brown). b Venn diagram showing the number of samples affected by deletion (blue) and hyper-methylation of the promoter (red). c Violin plots showing the change in expression of FAS in tumor samples with deletion (n = 88) and tumor samples with hyper-methylated promoters (n = 67)

