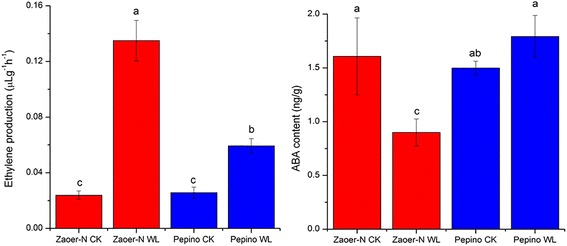
Fig. 4.

Ethylene production (left) and endogenous ABA (right) in Zaoer-N and Pepino 2 days after waterlogging treatment. ‘WL’ and ‘CK’ represent waterlogging treatment and control. Data is the average ± standard error (n = 3). Means with the same lowercase letter do not significantly differ by the least significant difference (LSD) test at p ≤ 0.05 with a completely randomized design
