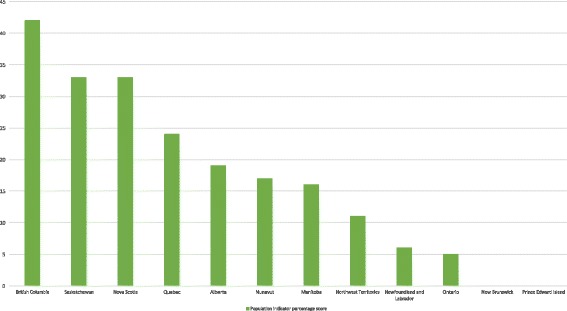
Fig. 1.

Percentage scores on CHARPP population indicators by province or territory. All current harm reduction policy documents in a given jurisdiction were coded on 9 population quality indicators (1 = indicator met; 0 = indicator not met). We added together all population indicator scores of “1” for each case and divided by the potential total (9 × no. of documents in the case), resulting in a percentage score on population quality that could easily be compared between cases. The higher the case’s overall percentage score (out of a maximum of 100), the greater the number of policy documents in the case that exemplify high-quality harm reduction policy. Note that the Yukon Territory had no current harm reduction policy documents and is thus excluded from this figure. New Brunswick and Prince Edward Island had current harm reduction policy documents; however, none met any of our population indicators
